|
Recent Earthquakes
Felt An
Earthquake?
Historical Intensity Maps
South Asia Seismicity
Great Earthquakes
Tsunamis & Seiches
GSHAP Hazard Maps
Seismology Links
Be Earthquake Safe!

Advertisement
Advertisement
Advertisement
|
|
|
Historical Intensity
Maps |
|
|
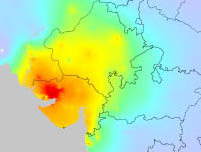
 Recently intensity
data from historic earthquakes such as
the 1811-1812 New Madrid and 1819 Allahbund
earthquakes, have been displayed
utilizing a similar colour
scheme as
ShakeMaps. The ASC has used
macroseismic/intensity data collected after earthquakes in India
to create
Historical
Intensity Maps for some of the most significant
events. Not only was information from published scientific studies
used, but felt reports that were sent in using
the 'Felt
A Quake?'
page as well. So if you felt any of the earthquakes listed
here (or any others), do take the time to fill out the 'Felt
A Quake?' online questionnaire. Your information
can contribute greatly in updating existing maps or creating new
maps. Recently intensity
data from historic earthquakes such as
the 1811-1812 New Madrid and 1819 Allahbund
earthquakes, have been displayed
utilizing a similar colour
scheme as
ShakeMaps. The ASC has used
macroseismic/intensity data collected after earthquakes in India
to create
Historical
Intensity Maps for some of the most significant
events. Not only was information from published scientific studies
used, but felt reports that were sent in using
the 'Felt
A Quake?'
page as well. So if you felt any of the earthquakes listed
here (or any others), do take the time to fill out the 'Felt
A Quake?' online questionnaire. Your information
can contribute greatly in updating existing maps or creating new
maps.
Difference between ShakeMap & Historical
Intensity Maps
Historical Intensity Maps should not be confused with traditional
ShakeMaps.
ShakeMaps
display shaking intensities of earthquakes using measured
ground motion data (peak velocity and acceleration) obtained from
instrumental readings. Historical Intensity Maps
on the other hand display the extent of the shaking and the damage
caused during a particular event derived from
human perceptions & damage to the the built up environment.
Please note, that each of these
earthquakes have been re-assessed
by the ASC, with additional data, and reduced to
EMS-98
(corresponding values from MSK-64, -81 & -92)
taking into account building construction methods
in South Asia and the sometimes
misleading effects of liquefaction on shaking intensity. This list
will be periodically updated without notice.
 |
Do Not Plagiarize! |
|
|
Historical Intensity Maps
published on this page may be reproduced elsewhere in print or
electronic form (including WWW links)
without removing the ASC logo from any maps and by
provided a reference is cited to the ASC website
i.e. "www.asc-india.org". |
'Io' column indicates the highest
EMS-98 intensity
determined from the same. Note, requests for intensity data sets
or methods used to produce these maps will not be
entertained. Interested parties should please consult cited
references. Additional maps will be made available online once
published macroseismic studies are available. |
|
Date |
Mw |
Latitude |
Longitude |
Location |
IO |
|
|
|
|
|
|
|
|
8 October 2005 |
7.6 |
34.432 |
73.537 |
Kashmir-Kohistan Mainshock |
9 |
|
26 December 2004 |
9.2 |
03.295 |
95.982 |
Sumatra-Andaman Mainshock |
9 |
|
26 January 2001 |
7.7 |
23.422 |
70.310 |
Bhuj, Gujarat |
10 |
|
29 March 1999 |
6.4 |
30.511 |
79.421 |
Chamoli, Uttarakhand |
8 |
|
22 May 1997 |
5.8 |
30.511 |
79.421 |
Jabalpur, Madhya Pradesh |
8 |
|
30 September 1993 |
6.2 |
18.089 |
76.473 |
Killari, Maharashtra |
9 |
|
20 October 1991 |
6.8 |
30.769 |
78.791 |
Uttarkashi, Uttarakhand |
9 |
|
20 August 1988 |
6.9 |
26.719 |
86.626 |
Udaypur Gahri, Nepal |
8 |
|
11 December 1967 |
6.5 |
17.540 |
73.840 |
Koyna, Maharashtra |
8 |
|
30 May 1935 |
7.8 |
28.870 |
66.400 |
Quetta, Balochistan |
10 |
|
15 January 1934 |
8.1 |
26.600 |
86.800 |
Nepal-Bihar border |
9 |
|
27 August 1931 |
7.3 |
29.200 |
67.600 |
Mach, Balochistan |
9 |
|
2 July 1930 |
7.1 |
25.800 |
90.200 |
Dhubri, Assam |
8 |
|
8 July 1918 |
7.1 |
24.500 |
91.000 |
Srimongal, Bangladesh |
8 |
|
4 April 1905 |
7.8 |
32.100 |
76.400 |
Kangra, Himachal
Pradesh |
9 |
|
12 June 1897 |
8.1 |
25.500 |
91.000 |
Shillong Plateau, Meghalaya |
9 |
|
10 January 1869 |
7.4 |
25.500 |
91.000 |
Cachar-Manipur |
7 |
|
26 August 1833 |
7.6 |
27.700 |
85.700 |
Eastern Nepal |
8 |
|
16 June 1819 |
8.2 |
23.000 |
69.000 |
Allah Bund, Gujarat |
9 |
|
|
|
|
|
|
|
|
|